 |
|
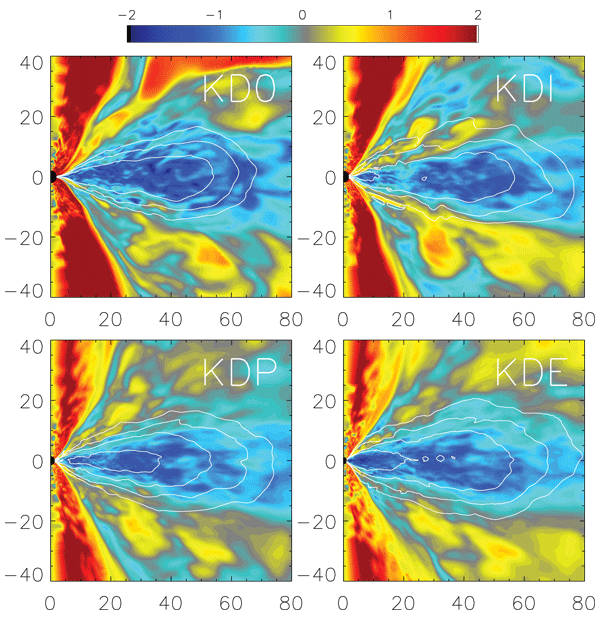
Figure 18: Color contours of the ratio of azimuthally averaged magnetic to gas pressure,
 .
The scale is logarithmic and is the same for all panels; the color maps saturate in the axial funnel. The
body of the accretion disk is identified with overlaid density contours at .
The scale is logarithmic and is the same for all panels; the color maps saturate in the axial funnel. The
body of the accretion disk is identified with overlaid density contours at  , ,  , ,  ,
and ,
and  of of  . The individual plots are labeled by model. In all cases, the magnetic
pressure is low ( . The individual plots are labeled by model. In all cases, the magnetic
pressure is low ( ) in the disk, comparable to gas pressure ( ) in the disk, comparable to gas pressure ( ) in the
corona above and below the disk, and high ( ) in the
corona above and below the disk, and high ( ) in the funnel region. Image reproduced
by permission from [72], copyright by AAS. ) in the funnel region. Image reproduced
by permission from [72], copyright by AAS. |
Marek A. Abramowicz and P. Chris Fragile, "Foundations of Black Hole Accretion Disk Theory",
Living Rev. Relativity, 16 (2013), 1, doi:10.12942/lrr-2013-1, URL (accessed <date>): http://www.livingreviews.org/lrr-2013-1. This work is licensed under a Creative Commons License.
© The author(s), except where otherwise noted.
This work is licensed under a Creative Commons License.
© The author(s), except where otherwise noted.
Living Rev. Relativity, 16 (2013), 1, doi:10.12942/lrr-2013-1, URL (accessed <date>): http://www.livingreviews.org/lrr-2013-1.
This work is licensed under a Creative Commons License.
© The author(s), except where otherwise noted.